
Wii U Homebrew App Store – find and install apps the easy way
31st January 2026
Play Windows 95 & 98 games on your modern computer – VirtualBox PC emulation
4th February 2026
Is your hard drive about to die? Find out before it happens.
We all rely on the hard disks in our computers and laptops to keep our data safe. Although we often have some sort of backup scheme with cloud storage or some other hardware solution, any hard drive failure is at best incredibly annoying, and at worst a disastrous loss of work and information.
So how can we tell if our hard drive is on its last legs and about to die?
This is where we need to be S.M.A.R.T.
S.M.A.R.T.
SMART stands for Self-Monitoring, Analysis, and Reporting Technology which is built into most mechanical and solid state drives, our HDDs, SSDs and NVMe drives. It tracks and records various events and measurements within the drive and saves these so we can examine the health and performance of the hardware.
To read this information we need a special app on our computer that can pull this info out of the drive and show it to us in a human understandable format.
On a Windows PC you can use CrystalDiskInfo which is a free app or for more detail Hard Disk Sentinel. On a Mac DriveDx or using homebrew through your terminal will work. And on Linux you can use Smartmontools. All of these will give you access to the S.M.A.R.T. data so you can work out the drive health.
I’m on a Windows Pc so I’ll show you both CrystalDiskInfo and Hard Disk Sentinel.
What brought this topic to my attention was an eBay listing for an 8TB hard drive when I was looking for some extra data storage. This is the listing where the seller was very up front about what they were selling, but only if you knew how to read the numbers.
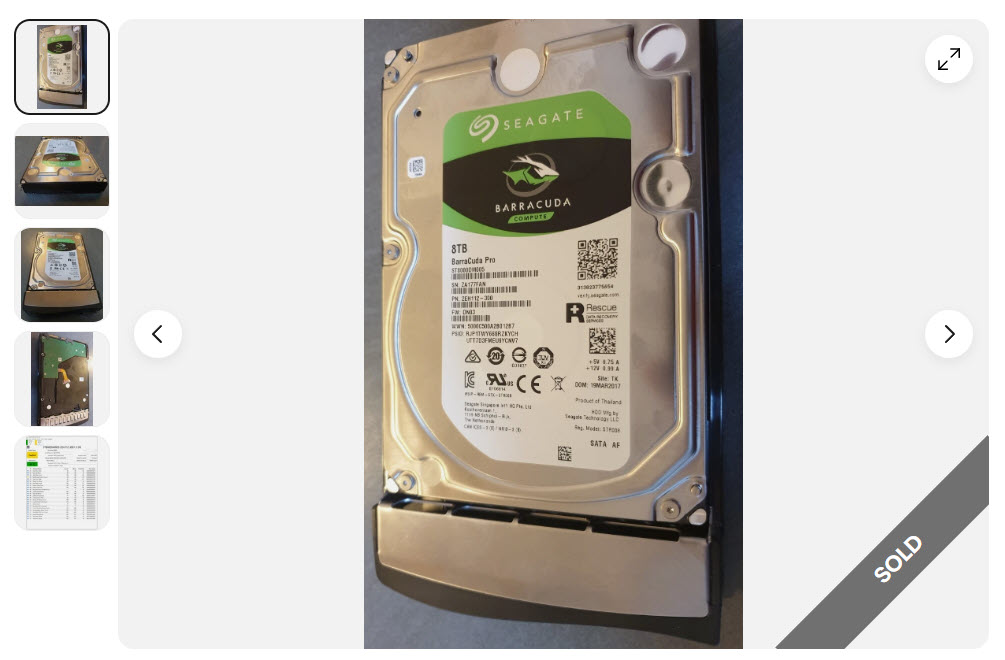
The drive itself looked in very good condition and had only recently been taken out of a working server. It was being sold as a used device and when I first saw the listing it was priced at only £40 which was about half the price of any buy it now listings.
But the image of the CystalDiskInfo results tells us everything we need to know.
Viewing S.M.A.R.T. Data
But first let’s look at how we can get to these numbers.
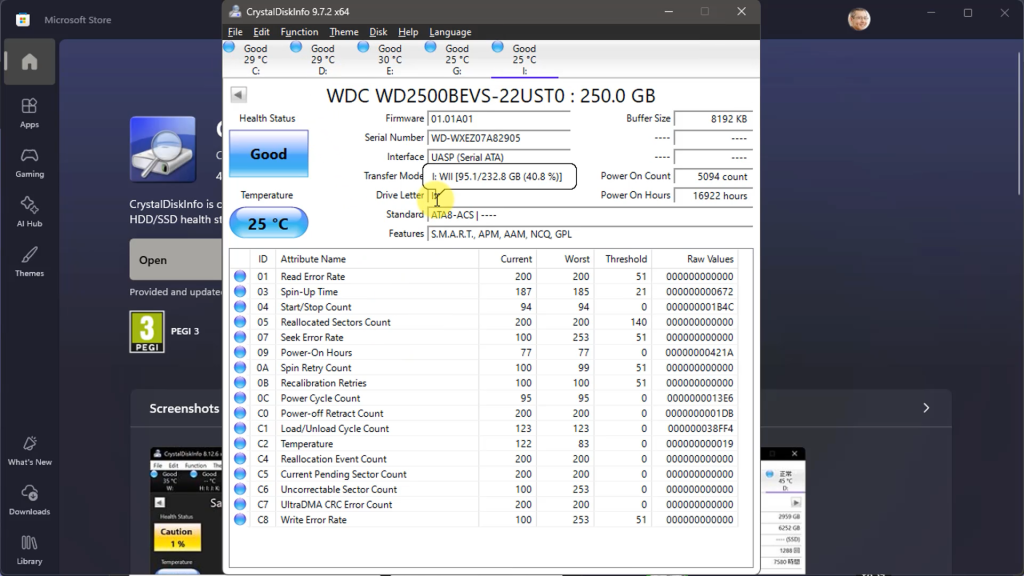
On your PC CrystalDiskInfo is a free download from the Microsoft Store. Simply go to it’s listing and Download and Install it. When you open the app it will list your hard drives and let you see the SMART data from it in a simple list format.
Now comes the hard bit where we need to work out if the drive is healthy or not.
Along the top of the window you can see an overall rating for each drive. Clicking on a drive will bring up the data for that disk.
You’ll now get a percentage health figure for the drive. As you can see mine all seem in good condition with pretty much perfect health.
The main table shows you the values that drive is reporting. This is where the drives can differ between brands. Most will report specific and important values such as Relocated Sectors Count and so on, but other values may differ. The numbers used as well sometimes differ but what they mean is fairly standarised.
First off for each value you’ll get a number of readings. The current reading and worst reading speak for themselves. The threshold value is the value beneath which that parameter registers as a fail. On most parameters these 3 numbers can be thought of as a percentage health figure. Sometimes using 0 to 100% health, sometimes using 200 or some other value as maximum health. This health figure is calculated by the disk drive based on the readings it has taken from the drive hardware. It’s not an absolute value, but the drive telling us if it thinks there is a problem in that area.
What we’re really looking for are values for either current or worst that are falling, especially if they are getting close to the threshold. Once a value goes below the threshold it’s likely to fail very soon.
These health values are calculated by the drive firmware, but we can also look at the Raw Values to give is a better understanding of the hardware condition. These tend to be the number of times that event was triggered.
For some parameters such as Power-On Hours or Temperature the value is just for information. For others such as Uncorrectable Sector Count these give us a great insight into the actual drive health even if the firmware believes things to be OK at the moment.
So let’s go back to the 8TB drive I was looking at on eBay.
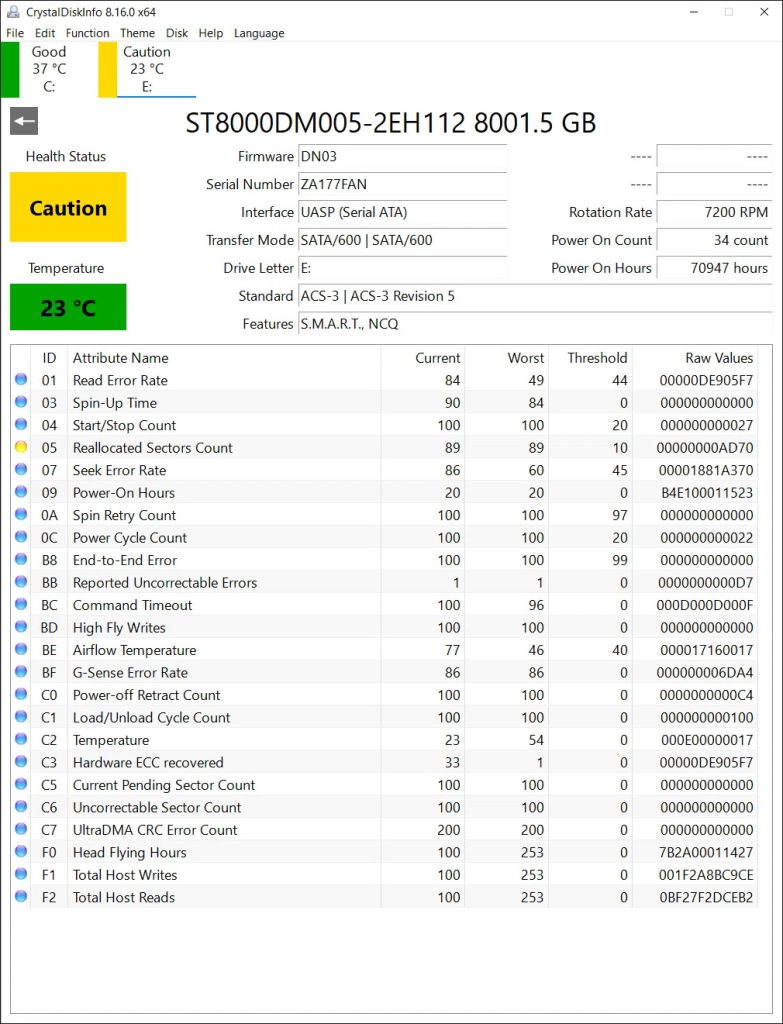
Instantly you can see that the drive is saying that its health is not good. The amber Caution notice means that some things are going wrong. If we now look in the data table there are certain values that are more significant than others.
The Read Error Rate event has been triggered 233375223 times! (Numbers are in hexadecimal) Although the current health is rated at 89 that has to be a worrying raw value. The 49 in the worst column tells us that the drive had a serious issue at some point, almost failing below the danger threshold even though it has now been behaving better. This is where you have to think about what might be happening with the drive. Perhaps there is a bad region on the drive that hasn’t been accessed for a while. Whatever the reason this level of read errors has to be a bad sign.
The Reallocated Sectors Count tells us how many sectors on the drive have been detected and moved as they can no longer be relied on to store data. Again the health is shown as 89, well above the threshold, but 44400 bad sectors is not good.
Similarly the Seek Error Rate has racked up over 400 million events and 215 Uncorrectable Errors.
So overall you can build up a picture of a drive that is still working and probably not giving any problems while using the computer, but one that is definitely going to die some time soon, or at least corrupt blocks of data on the drive.
Having seen this I didn’t bid for the drive, even at the low price. Let’s face it a dead drive isn’t worth any price! But it did eventually sell for around £80.
So hopefully this example has shown you what sorts of things to look out for in the drive S.M.A.R.T. data. Don’t just go by the drive health values, look at the raw values to build up a better picture of the overall drive health and warning signs.
So what should you do with your computer?
I’d advise checking drive health every month. Just spin up your app and take a quick look. If any raw values have triggered for the parameters we’ve been looking at start to keep a closer eye on them. If they continue to rise, even slowly, start thinking about replacing the disk before you lose some important data.
I did mention that there are some paid applications such as Hard Disk Sentinel. These applications will still be using the same SMART data but they do tend to give you better interpretation of the results, similar to what we’ve been doing manually. They also can provide background monitoring of drive health so you’re warned of pending problems as soon as they start to appear.
I personally just use CrystalDiskInfo every month but if you feel you’d like the security of automated monitoring them have a look at the paid apps.
So, do keep an eye on your hard drives and protect yourself from a data loss disaster.
Some S.M.A.R.T. Parameters and What They Mean
1. Reallocated Sector Count
What it means:
The number of bad sectors that have been remapped to spare sectors.
Why it matters:
A rising value indicates physical disk degradation. This is one of the strongest predictors of disk failure.
2. Current Pending Sector Count
What it means:
The number of sectors waiting to be remapped because they could not be read correctly.
Why it matters:
If this value is greater than zero, data loss or future reallocation is likely.
3. Uncorrectable Sector Count
What it means:
The number of sectors that could not be recovered using hardware error correction.
Why it matters:
Indicates permanent data loss at the disk level and a high risk of failure.
4. Read Error Rate
What it means:
The rate of hardware read errors while accessing disk data.
Why it matters:
High or increasing values may point to surface defects or failing read heads (mainly HDDs).
5. Seek Error Rate
What it means:
The frequency of errors while positioning the read/write heads (HDDs).
Why it matters:
Mechanical issues can cause performance degradation and eventual failure.
6. Spin-Up Time
What it means:
The time required for the disk platter to reach operational speed (HDDs).
Why it matters:
Longer spin-up times can indicate motor wear or insufficient power.
7. Start/Stop Count
What it means:
How many times the disk has been powered up or spun down.
Why it matters:
Excessive cycles increase mechanical wear, especially in HDDs.
8. Power-On Hours (POH)
What it means:
Total number of hours the disk has been powered on.
Why it matters:
Helps estimate disk age and remaining lifespan.
9. Temperature (Airflow / Drive Temperature)
What it means:
The current or maximum operating temperature of the drive.
Why it matters:
Sustained high temperatures significantly reduce disk longevity.
10. Command Timeout
What it means:
The number of aborted operations due to disk not responding in time.
Why it matters:
Can indicate failing electronics, cabling issues, or controller problems.
11. Power Cycle Count
What it means:
The number of times the disk has been fully powered on.
Why it matters:
Frequent power cycling can stress electronic and mechanical components.
12. Wear Leveling Count (SSD)
What it means:
An indicator of how evenly flash memory blocks have been used.
Why it matters:
Helps estimate remaining SSD lifespan.
13. Total Bytes Written / Host Writes (SSD)
What it means:
The total amount of data written to the SSD.
Why it matters:
SSDs have finite write endurance; approaching limits signals end-of-life.
14. Media and Data Integrity Errors (SSD)
What it means:
The number of errors related to flash memory integrity.
Why it matters:
Persistent increases suggest failing NAND memory.